Members
Discover the healthiest US states for dogs, ranked by air quality, water purity, and disease rates. Find the best environment for your dogs.

The Weekly Brief
The best of SHOWSIGHT editorials, weekly wins, and breeder commentary — delivered to your inbox every Sunday morning.
Our dogs’ health matters; any caring owner will tell you that. But which US state provides the healthiest environment for our four-legged friends?
We’ve examined the key factors impacting dog health nationwide, including air quality, water purity, tick-borne diseases, and flea seasons. From this, we’ve uncovered the healthiest states for our pups and the ones where dog ownership could be more challenging.
So, whether you’re a seasoned Cocker Spaniel owner or you’re looking to welcome home your first terrier, get ready to find out America’s best states for supporting a dog’s overall good health.
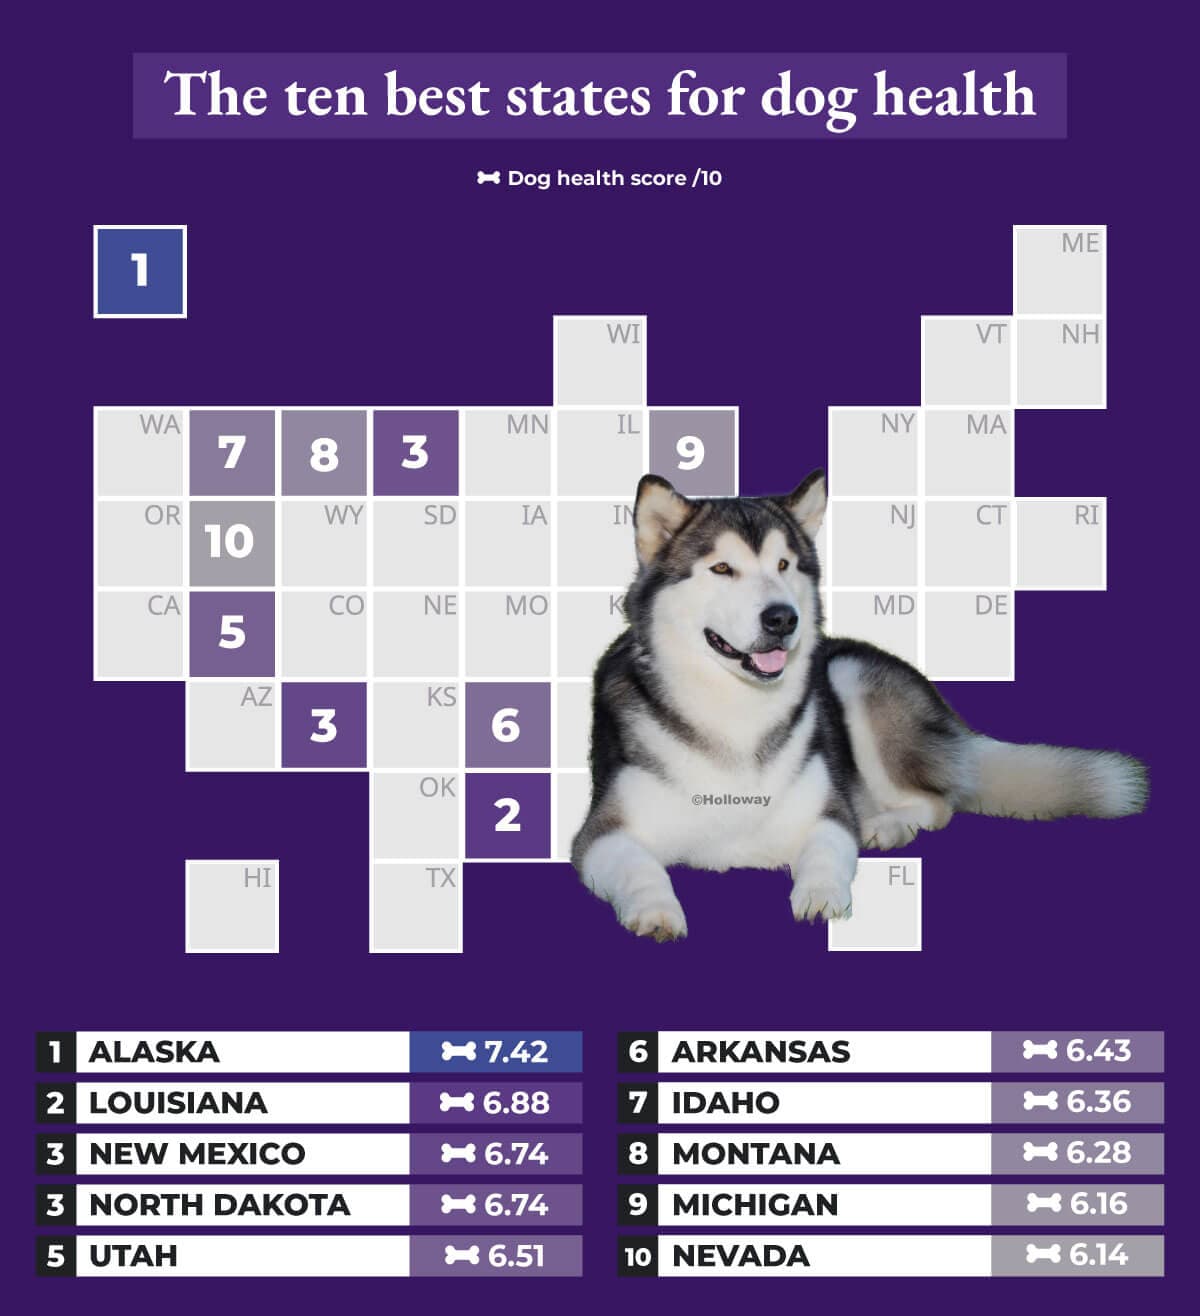
Alaska tops the list with a respectable dog health score of 7.42 out of 10. The impressive air quality index score of 29.1 is the best in the United States, while the low average temperatures suit breeds like the Alaskan Malamute, Newfoundland, and Siberian Husky.
Despite the flea and tick season lasting half the year (from May to October) in the Land of the Midnight Sun, the number of tick observations is low — just 3.4 per 100,000 people.
Swinging to the opposite end of the temperature spectrum, Louisiana’s average of 69.1°F, along with an average humidity of 75.7%, means this state might be more comfortable for single-coated canine companions.
The Bayou State also has a low percentage of impaired lakes and reservoirs, meaning if your dog loves to swim or go for a splash during their walks, this state is a good choice. In 2024, Louisiana’s Department of Environmental Quality (LDEQ) found that only 4.1% of lakes were deemed “impaired.”
While different in climate and geography, New Mexico and North Dakota share an impressive dog health score of 6.74.
New Mexico’s conditions, with an average temperature of 56°F, may appeal to dog owners seeking a drier environment. North Dakota, however, could be a safer bet for owners worried about fleas and ticks, as the Rough Rider State has a shorter season when the insects are most active (six months). This state also has a lower average percentage of positive tests for conditions such as Giardiasis, Anaplasmosis, Lyme disease, and Canine Influenza, also known as dog flu.
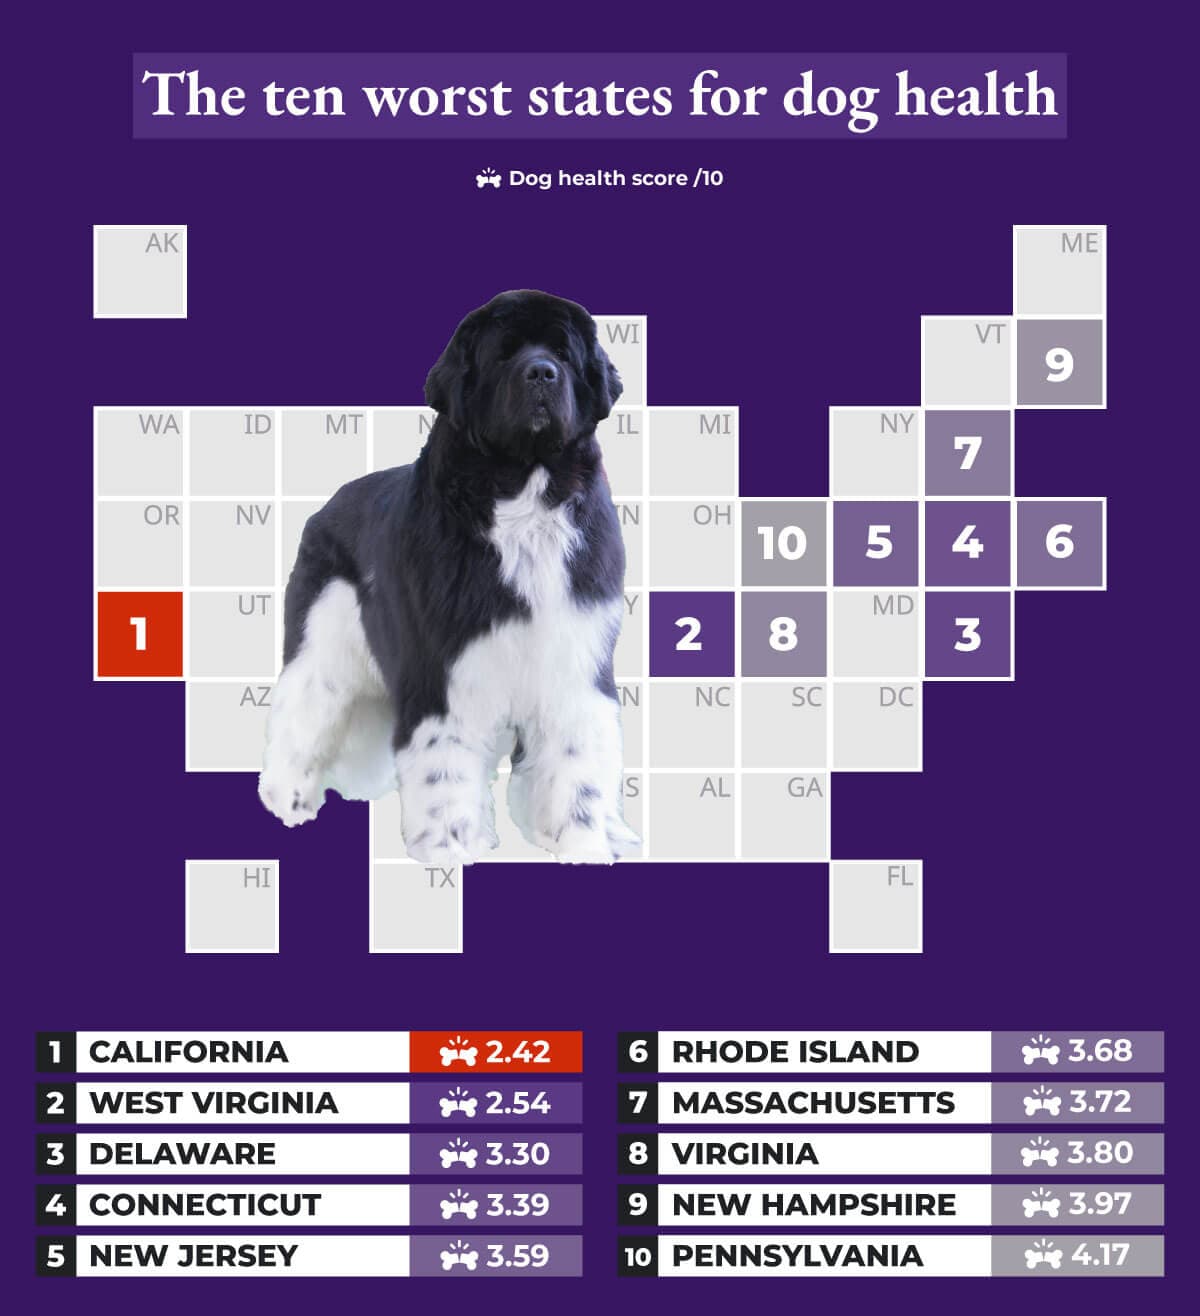
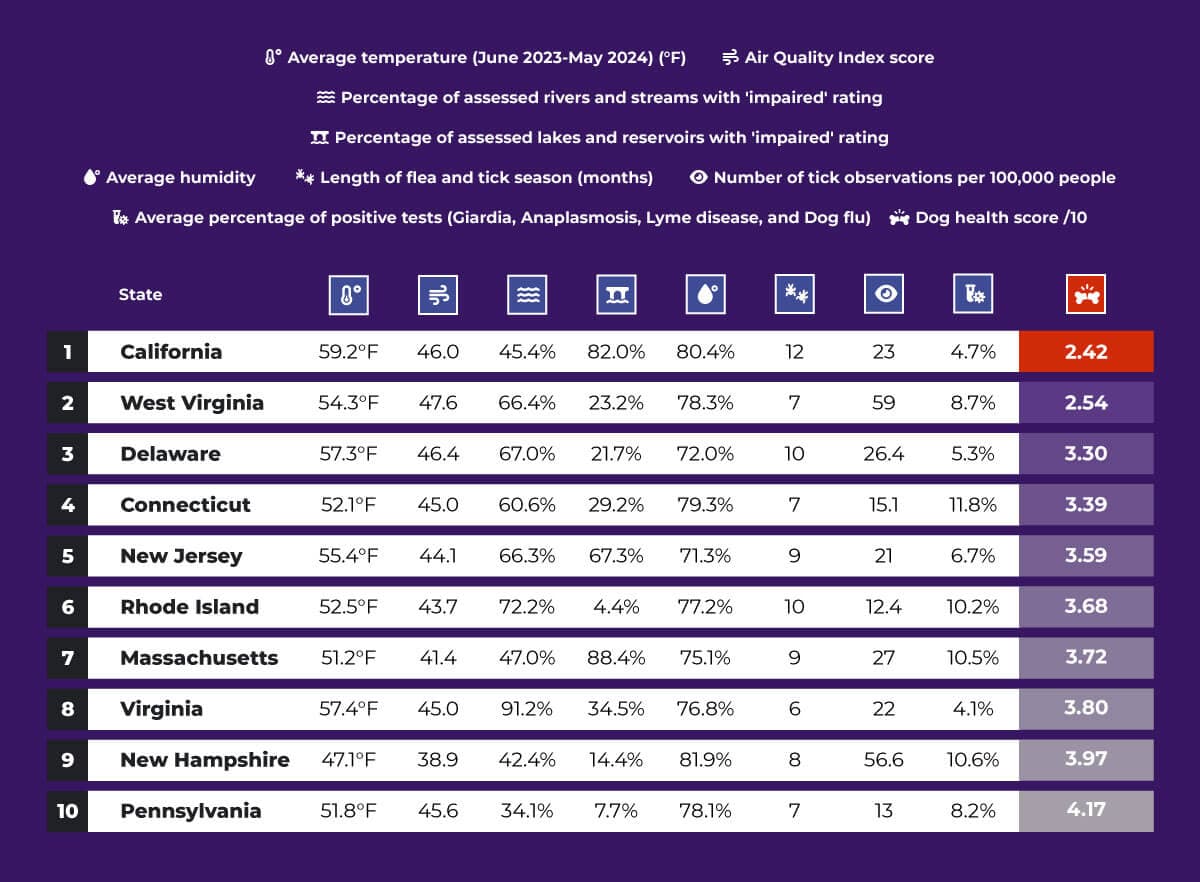
California’s score of 2.42 out of 10 means it ranks lowest among the states as a dog health destination. This is partly due to the state’s high percentage of lakes and reservoirs (82%) and rivers and streams (45.4%) rated as impaired, which could pose challenges for water-loving pups.
Additionally, the Golden State’s year-round flea and tick season, combined with 23 tick observations per 100,000 people, could worry many dog owners.
Ranking second from the bottom, West Virginia faces its own challenges for dog owners. The state’s air quality index score of 47.6 is one of the worst in the US, with only Utah and Georgia having poorer air quality.
In addition, the Mountain State’s tick observation rate of 59 per 100,000 people is the second-highest, just behind Vermont.
Delaware presents a mixed bag for dog owners. The Diamond State has a flea and tick season of 10 months, and its tick observation rate of 26.4 per 100,000 people could be a problem for dogs that love to run through grassy meadows or play outdoors with other pups. Delaware’s high percentage of “impaired” rivers (67%) could also limit water-based activities.
However, on a positive note, the state’s moderate temperature and humidity levels may provide a comfortable environment for many double-coated breeds.
We have found the quality of the local waters in each state by using United States Environmental Protection Agency (EPA) data. The Clean Water Act requires all states to monitor water for impairments and decide which waters do not meet water quality standards while reporting them to the EPA.
We have taken the number of waterways assessed in each state (i.e., recorded as either “good” or “impaired”) for all available uses. We then took the total of those and found the percentage that included “impaired” waterways.
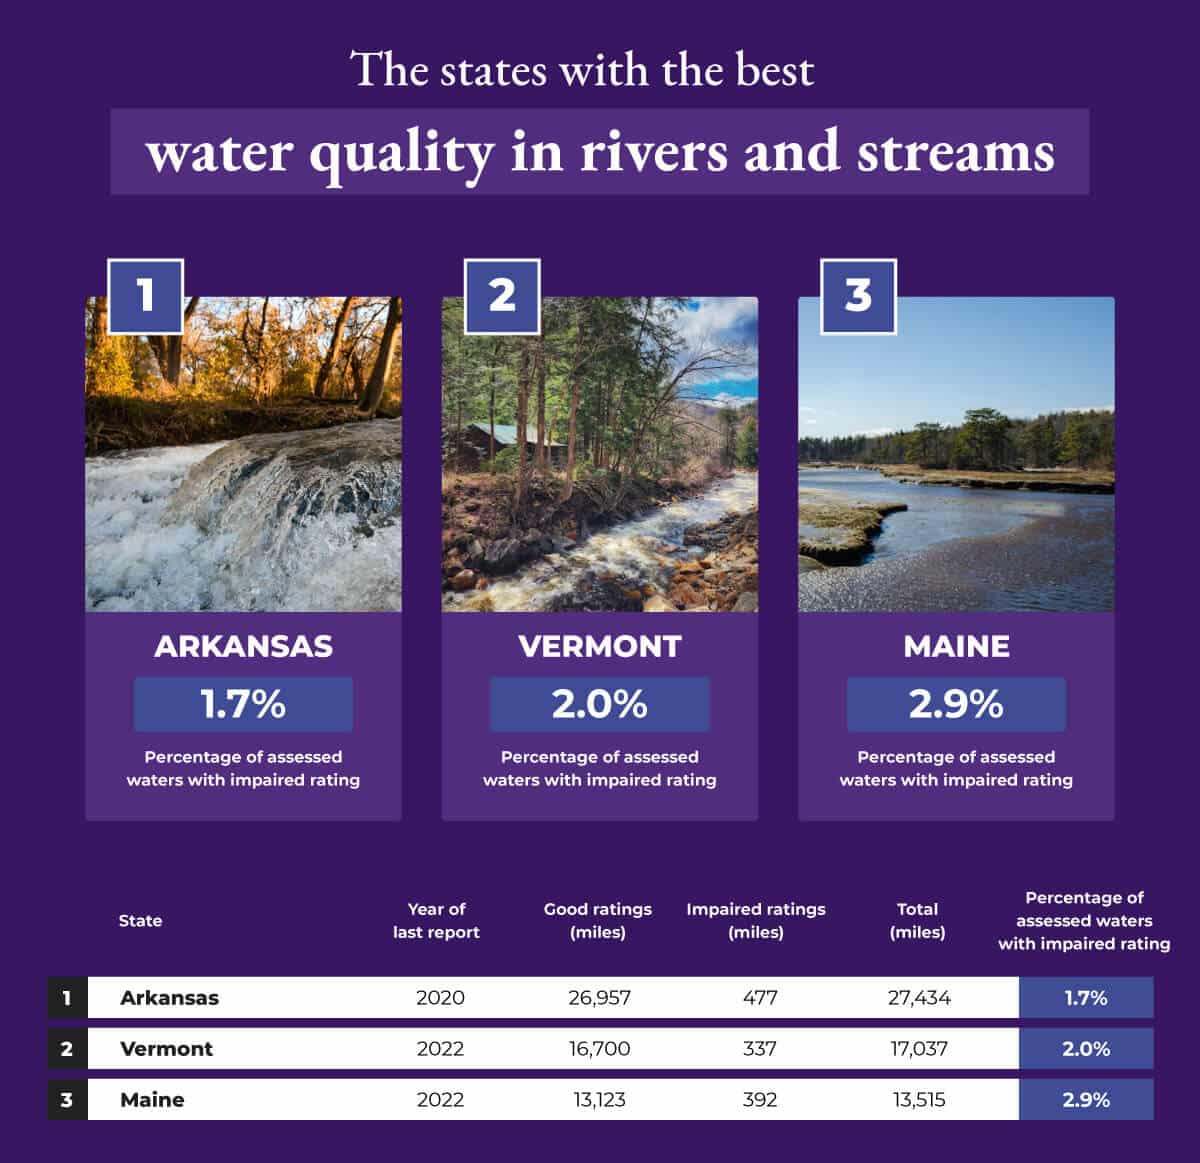
Arkansas has the best water quality in the US, with just 1.7% of rivers and streams receiving an “impaired” rating. The last report in 2020 found that only 477 miles of water were deemed below the quality standard out of the 27,434 assessed.
Vermont and Maine also fall below the 3% mark, with 337 and 392 miles of “impaired” water, respectively. This means that your dog can go for a swim without you needing to worry about a high likelihood of dangerous bacteria or aquatic weeds lurking within the water.
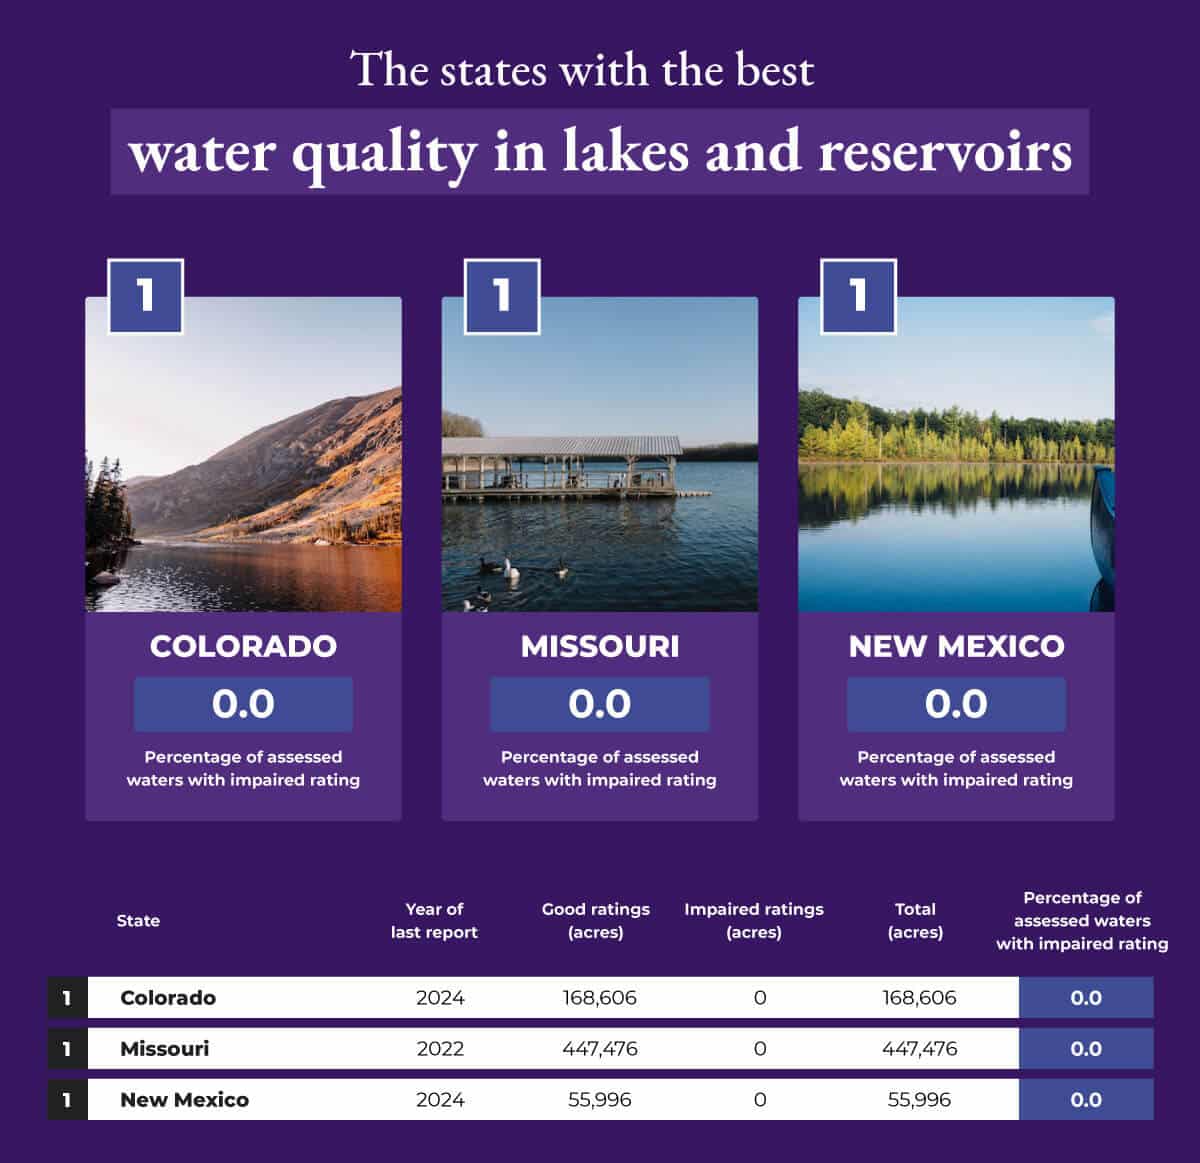
For dogs lucky enough to live near lakes and reservoirs, Colorado, Missouri, and New Mexico are where they’re most likely to be safest. Each one of these states has recorded zero acres of impaired water — Missouri even has almost 500,000 acres of water that have been deemed good.
This starkly contrasts with states like Kansas and Massachusetts, where 88% and above of their waterways are recorded as “impaired.”
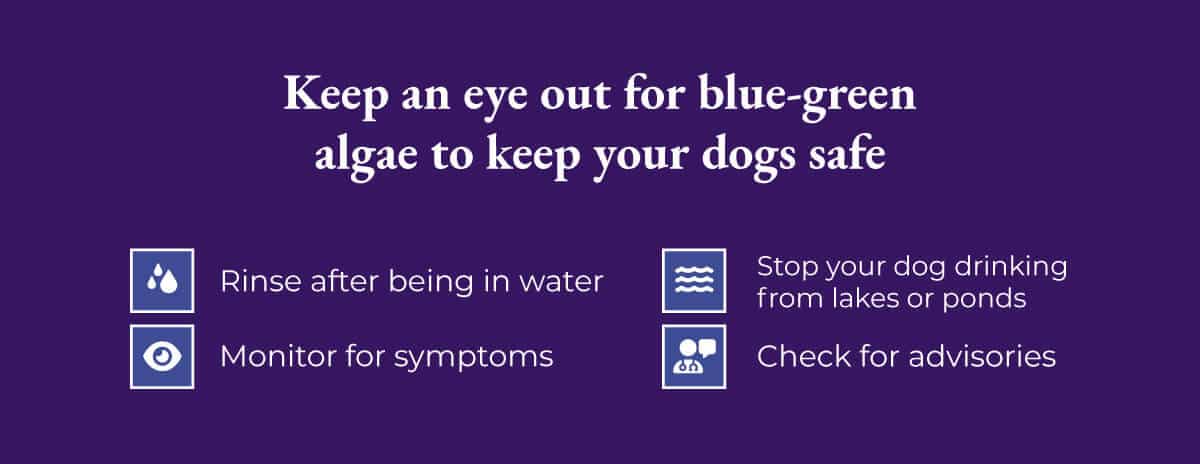
One thing to look out for when letting your dog play in non-flowing freshwater is blue-green algae. It is toxic and can be fatal if consumed in large quantities, which dogs can be known to do while playing in water.
As the name suggests, this type of bacteria can appear as green or blue-green scum on the surface of water but can sometimes look brown or red too. It may also look like paint in the water. When letting your dog explore any wet area, pay close attention to stagnant or slow-moving bodies of water, as these are prime breeding grounds for algae blooms — especially in high temperatures.
Here’s how to keep your dog safe from these blue-green algae blooms:
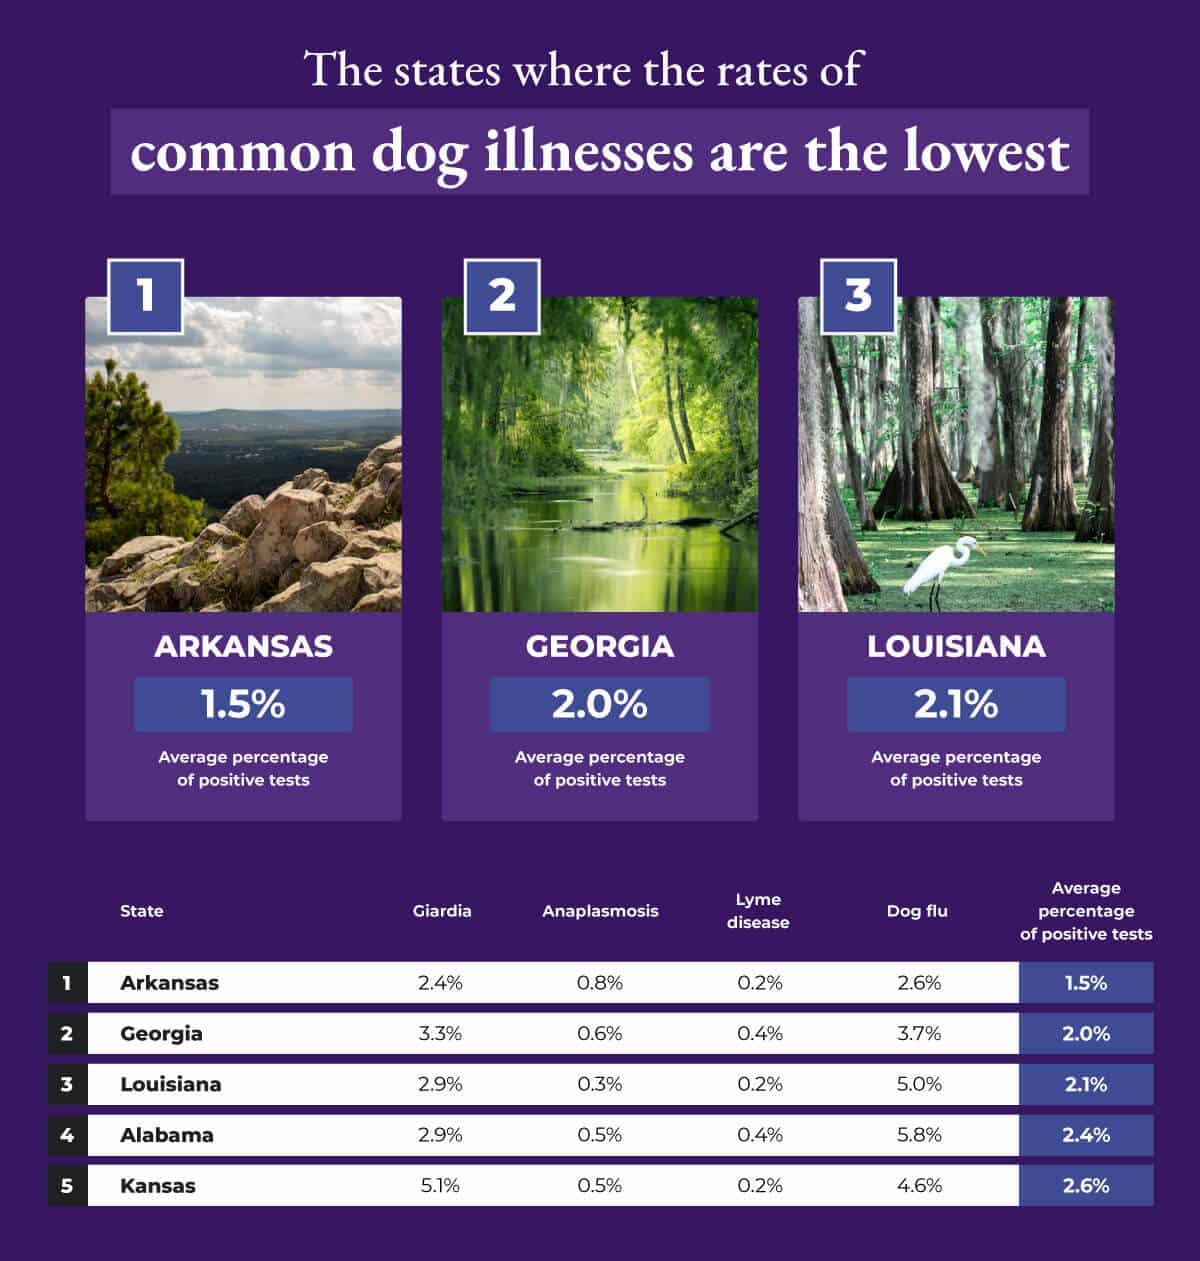
Arkansas has the lowest average percentage of positive tests at 1.5% for Giardia (2.4%), Anaplasmosis (0.8%), Lyme disease (0.2%), and dog flu (2.6%). Louisiana (2.1% average) and Georgia (2% average) rank second and third, respectively, for the lowest average percentage of positive tests.
At the other end of the scale, Maine has the highest average percentage of positive tests, at 13%. This is due to a large number of Anaplasmosis and Lyme disease cases, which are both caused by bites from infected ticks.
We’ve looked into the tick observation rates throughout the US to find where ticks are the most prevalent when broken down by population.
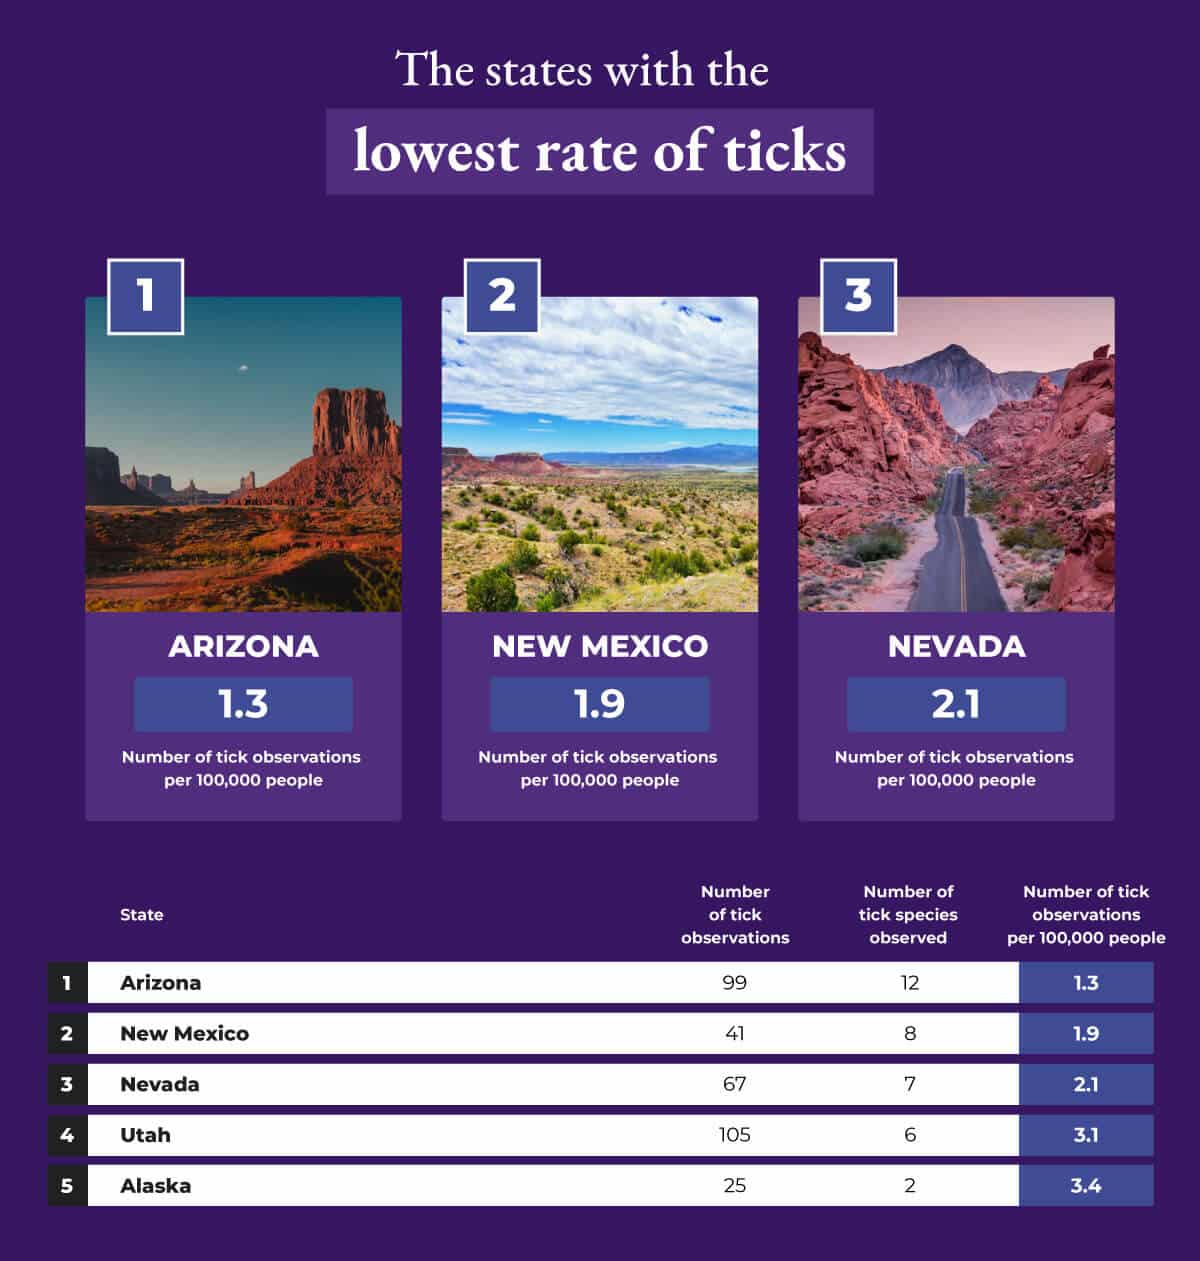
Arizona leads with just 1.3 tick sightings per 100,000 people, followed closely by New Mexico at 1.9 and Nevada at 2.1. However, Arizona has the highest number of tick species observed out of the top five, including the Bighorn Sheep Tick and Gulf Coast Tick.
Vermont has the unwanted title of the highest tick observation rate, at 149 per 100,000 people. This is more than double the next highest state of West Virginia at 59.4.
The CDC outlines that ticks use different strategies to find hosts, including detecting your dog’s breath, body odors, heat, moisture, vibrations, and even recognizing shadows.
They then wait on well-used paths while extending their first pair of legs to latch onto any passing host. Once they’re on, they travel to places where the skin is the thinnest — often the ear — and then bite.
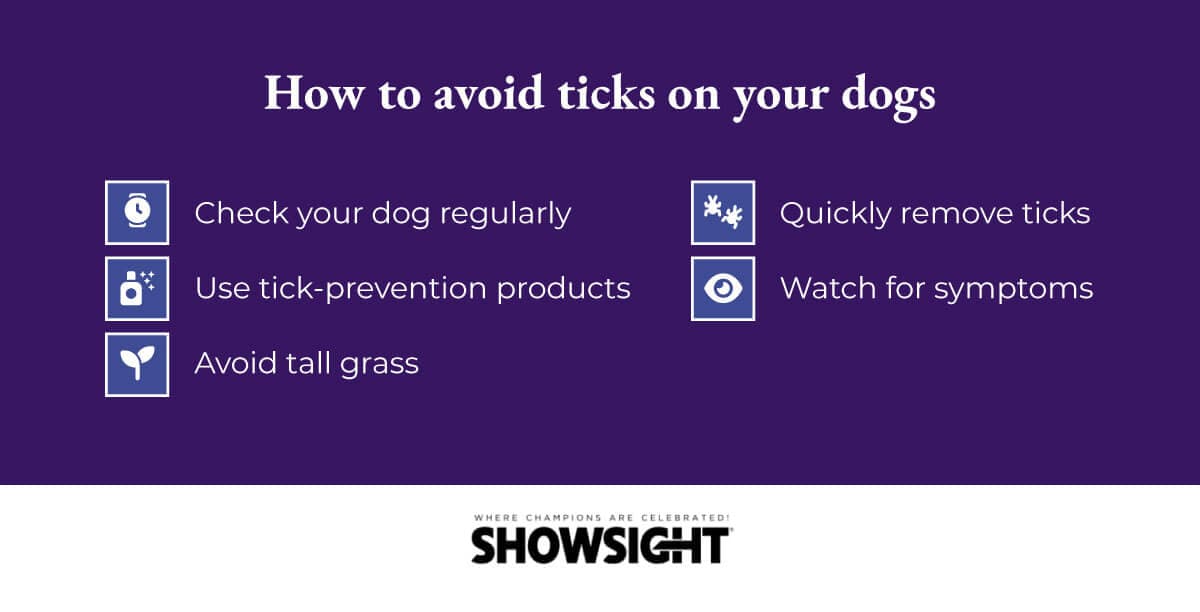
Here are some tips on how to avoid ticks, as well as Anaplasmosis and Lyme disease:
We took the average annual temperature per state from the NOAA National Centers for Environmental Information, using the following parameters:
We then collected the air quality score for each state from USA.com. Lower scores indicate better air quality in the Air Quality Index (AQI).
We found the water quality of the rivers and streams in each state from the United States Environmental Protection Agency*. We took the number of rivers, streams, lakes, and reservoirs with sufficient reporting information, i.e., those rated “Good” or “Impaired” rivers in each state for all available uses. We took the total of those with sufficient information and found the percentage that included “Impaired” waterways.
We pulled data from USA.com to find the average relative humidity in each state. For this study, the lower the percentage, the better.
We used Forbes research to find the states with the highest and lowest percentage of positive tests for top dog diseases.
For the flea and tick data, we used the American Kennel Club to find the length of flea season per state and iNaturalist data to find the state with the highest number of tick observations. The number of tick observations was then normalized against the state population, sourced from the World Atlas.
We combined the above factors and created a score out of 10 for each state using the PERCENTRANK formula. In this, the Air Quality Index score, number of tick observations per 100,000 people, and average percentage of positive tests for dog diseases were given a double weighting.
Lastly, we used the Pet Poison Helpline’s data on each state’s top three dog toxins.